 Article
Updated Thinking on Aerobic Assessment for Mountain Athletes
By: Scott Johnston
Posted:
Until recently, there were limited options for an endurance athlete to get a handle on his or her metabolic response to exercise at varying intensities. There are several good options, but I’m going to focus on the ones we usually default to for determining the two thresholds that represent important metabolic shifts. Knowing these two points will set you up well for controlling the intensity of your training. Be aware that the first test requires serious technology, such as an expensive heart rate monitor/GPS watch. For the no-tech test, skip ahead to the Nose Breathing section. But the second test is as simple as can be. It’s just demanding.
After wearable heart rate monitors became widely available in the early 80s, astute coaches and athletes noticed that on runs over about 30-45 minutes, the runner’s heart rate might rise while they maintained the same pace or even if they slowed the pace. Coaches called this “heart rate drift”, but it was only understood qualitatively. With the advent of the newer generation of heart rate monitors combined with a GPS in the same watch, the analysis of the “drift” moved from being a qualitative oddity to becoming a quantifiable, valuable, and actionable piece of data.
If while holding the same pace, your heart rate climbs more than 5% during an hour of continuous exercise, OR if, while keeping your heart rate steady, your pace slows more than 5% during an hour of continuous exercise, the chances are excellent that you began that hour at a heart rate that was above your aerobic threshold (AeT) or the top of Zone 2.
From a metabolic standpoint, heart rate drift means your energy requirements exceed your aerobic capacity. As you know from this article, when your energy demands exceed your aerobic capacity, your anaerobic system must make up the difference. It is this anaerobic contribution to the overall energy requirement that is causing your heart rate to slowly drift up during that hour.
We have had extensive experience administering, interpreting, and evaluating HR drift tests for hundreds of athletes over six years. The HR drift test correlates very closely to the expensive laboratory-administered gas exchange test (GET) we’ll discuss shortly when establishing your AeT. Besides the money savings, it has the benefit of being able to be re-tested whenever you desire. More on that when we get into the testing in the next section. This has become our go-to test, even for our elite athletes, to establish the top of Z2.
Our first choice is to do this test on a treadmill or a StairMaster (these look like short escalators) for mountaineers. This allows closer control and fewer variables to deal with. Runners should do this running on a 2% grade. Those who can’t run should or will do most of their aerobic base training hiking and should set the treadmill to 15% and hike. Mountaineers can use either a treadmill set to 15% or a stair machine.
NOTE: If you’re using one of these machines, do not hang on to the handrails. You will not have bars when you go outside, and hanging on makes it too easy.
Indoors HR Drift test on a treadmill or stair machine:
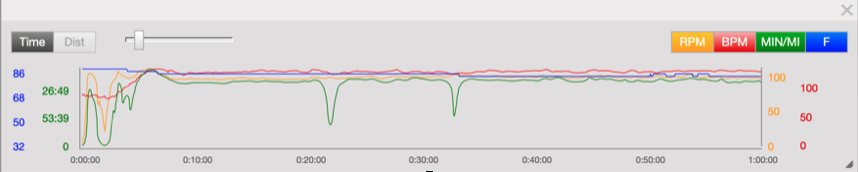
Using your cursor, select the first half of the session. In this graph, you would start that selection by dragging the cursor from about the 5min mark where the HR settled down till a bit past 30 minutes. It is not necessary to select the halves of the test exactly. Plus/minus a few minutes is fine. When you drag the cursor over the first half, you will see this:
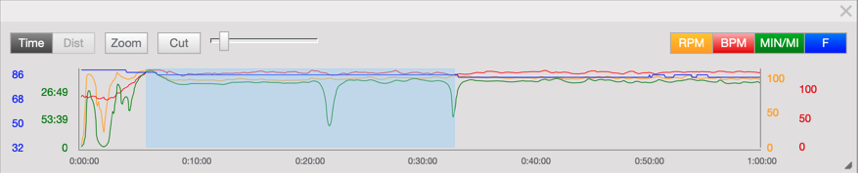
In the upper right of the Analyze screen, you will see the data for the selected portion.
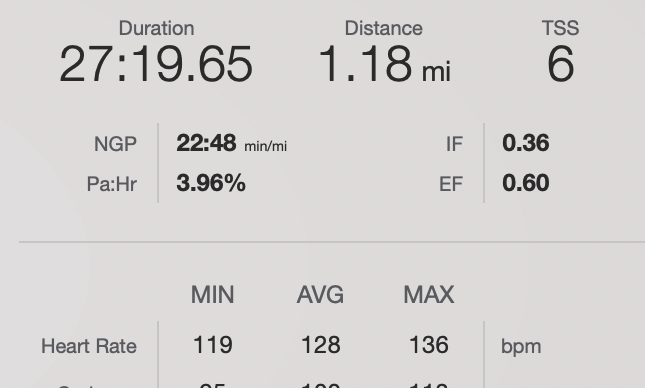
You can disregard the Pa: Hr because the pace and distance are probably inaccurate because the GPS does not work indoors. But you will see that the average HR was 128 for this first half of the text. Doing the same thing for the second half will give you the average HR for the second half.
In this test, there was virtually no upward drift in HR. That tells us that the starting HR (about 127 in this case) was well under this athlete’s aerobic threshold. Because this test showed no drift, I would normally suggest the athlete redo the test with a starting HR of about 135.
Use a Training Peaks premium account to analyze your heart rate drift by clicking on the analyze button in the data displayed in the upper right corner. You will see Pa: Hr. That’s the HR drift. This test must be conducted on either a flat course like a running track or a gently rolling loop course with less than 100ft (30m) elevation change per mile (1.6km). DO NOT USE AN OUT-AND-BACK COURSE. Inevitably one way will be more uphill than the other, and the results will skew the test. It is impossible to do this test hiking on a natural gradient outdoors. You will not be able to find a consistent grade that continues for one hour.
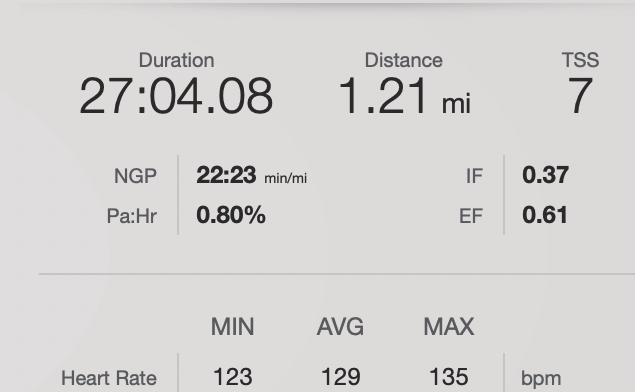
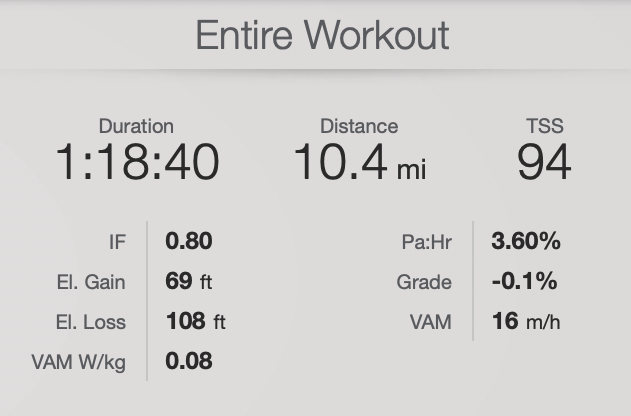
Warm up with the same protocol as above. Find a comfortable nose breathing pace and start the test when you establish that. Upload the data to your Training Peaks premium account and click the “analyze” button. A screen like the one below will show, and Pa: Hr is the number you are looking at because your GPS works outdoors.
In this case, an outside running HR drift test of 3.6% indicates that he was within his aerobic capacity. Notice that over 10 miles, this run only gained and lost around 100ft.
This is the ultimate low-tech method of determining your AeT. Not only that, but it also has the best real-time feedback on your metabolic state outside of a lab…… IF YOU PAY CLOSE ATTENTION.
Exercise scientists call the rate and depth of breathing ventilation. With specialized equipment, they can measure how much air your lungs are pumping in and out each minute and the percentage of oxygen and CO2 in each breath.
You may have heard the terms “first and second ventilatory thresholds (VT1 and VT2)”. That same specialized lab equipment can pinpoint these points which occur at important metabolic events. We, laymen, can also get close to locating these points by carefully monitoring our ventilation (rate and depth of breathing). The first metabolic threshold you cross (VT1, often called the aerobic threshold) corresponds very closely for almost all of us with the upper limit of nose breathing or where you can speak in complete sentences.
VT2 corresponds to another noticeable jump in ventilation where you can only manage one or two words. Below this, breathing will be steady and deep but not labored. Above this point, you are in a state of hyperventilation where your body is trying desperately to blow off excess CO2. In the old days, we called this point break-away breathing.
For the perceptive athlete, there is a noticeable jump in ventilation at both these thresholds. Since they occur at significant metabolic points, it behooves you to notice them. That way, when you are out for a run, hike, or skin and you’ve forgotten your HR monitor, you will be able to determine your metabolic state. Are you in Zone 2 or pushing well into Z3 because you are forced to breathe through your mouth?
Be aware that your AeT and AnT heart rates will vary daily, depending on your recovery state. So by blindly adhering to heart rate, you may be overreaching by trying to hit your AeT HR when you are tired.
Whereas ventilation is a direct result of the metabolism fueling your exercise, paying attention to your breathing during your training will alert you to when your AeT is a bit lower on a day when you are tired. It is like having that fancy lab testing equipment with you during each run.
I used to call this the gold standard: A gas exchange test done in a laboratory and usually costing $200-$300. The best use for this test is to determine where you are getting the calories that propel you: Are they from fat or carbohydrates? This is best done with a metabolic efficiency test (MET), which only some testing labs are familiar with. Most labs will offer to have you do a maxVO2 test. The protocols for these two tests are quite different. For the MET, you should be in a fasted state. For the maxVO2, you must have eaten some carbohydrates within 30-60 minutes. There are other differences that I won’t go into here. If all you want to do is determine your aerobic threshold (AeT, top of Zone 2), this test is overkill. This test is for the uber-curious or the elite athlete who plans to get tested frequently at the same lab.
Long ago, this was my go-to test for determining AeT and checking if the skiers I was coaching were staying under AeT during long, easy workouts. But I needed to be there in person to test. You can test yourself. But this test is, again, for the curious who plan on frequent testing to control the progression of their training. It’s a bit overkill for most folks, and these lactate meters are a few hundred dollars. The test strips are also expensive. I have written an in-depth “how to” lactate test article that I will link to soon.
Over the past few decades, I have moved from basing training zones entirely on blood lactate tests or laboratory Gas Exchange Tests to the more straightforward but high-tech HR drift test, which still requires expensive equipment and a Training Peaks account. This is still the test we administer to all of our coached athletes. We confidently recommend it to anyone. However, there is something incredibly alluring about the no-tech nose breathing/ventilation test. It may tune you into your body even more than paying attention to your heart rate. Suppose you are going to experiment with the nose breathing test. In that case, we recommend that you do so with a heart rate monitor and learn to correlate these two physiological markers to each other and, most importantly, to how you feel.
I like to use this very simple, but in my view, the best test for determining the anaerobic threshold. The results of this test are the simplest to interpret, easiest to implement, and, therefore, most useful by a coach or athlete. This threshold, by any of its several names, is your endurance limit. The value you determine using this test, whether using heart rate, running pace, or power, will be an actual measure of the maximum work rate you can sustain for an extended length of time. Your AnT will likely vary under different conditions/events. A test running on the flats is probably not going to yield the same average heart rate as an uphill hike with a pack. These two will most certainly yield different average paces.
If this doesn’t seem “sciency” enough for you, consider an example:
This is as actionable as a piece of data can be and much more useful to a coach or athlete in terms of programming than a blood lactate test running on a treadmill would have been for determining AnT.
The test can be as short as 20 minutes for someone just starting out with this kind of training or up to an hour for a world-class athlete. All you are going to do is run, ski, cycle or hike steeply uphill as fast as you can for the alotted time. It will feel like a race or time trial. If you are careful not to start too hard and blow up 5 minutes into the test, your average heart rate, pace, or power is going to be the maximum you can sustain for that period. Bingo. It is that simple.
I prefer this to any other test because it is actually measuring your performance. It is not measuring a proxy for performance, such as interpreting the RER from a gas exchange test or trying to suss out where the blood lactate curves make that bend upward.
Warning: This test is hard and should only be conducted when you are well-rested if the results are going to be meaningful. Doing this test tired will still feel very hard, but the average heart rate and pace will be lower than in a rested state.
Once you have conducted these two tests, you will have a decent snapshot of how your metabolism responds to exercise. That’s a powerful tool and can guide your training if you pay attention. By comparing the metabolic responses to exercise for an athlete before and after six months of the type of training we promote, we will be able to see how you can make the best use of the test info you just completed. While Bob is not his real name, this example is not fictitious. We see this kind of improvement in athletes we coach and hear from athletes training on their own.
On week one: Bob is 31 years old and has a busy work and family life. He has recently read Training for the Uphill Athlete and begun to train using the methods we promote. He has a high work capacity from playing ball sports through college and participating in 2-3 Crossfit workouts a week for the past three years. In the past, most of his running workouts have been done at a pace that was as fast as he could maintain for the time or distance he could squeeze in. If he had 30 minutes, he’d run as hard as he could for 30 minutes. If he had an hour, he’d run as hard as he could for that hour. He had the intensity needle pinned to the red zone for almost all his runs. The results of his heart rate drift test showed his aerobic threshold to be 136bpm at 11:30 min/mile (7:08 min/km), which he found to be a very easy effort. It was so easy that he was convinced that either he did the test wrong or we must be smoking something to suggest that training at this intensity could accomplish any training effect. After making sure that the test was correctly done, his Evoke coach explained to him that this result was, in fact, a good measure of his aerobic capacity. This was all the energy his aerobic system was capable of producing right now before the anaerobic or glycolytic metabolic system had to begin to provide more than about 50% of his energy needs.
Next came the anaerobic threshold test, an all-out 30-minute run where his average heart rate was 168 and his average pace was 9:20 minutes/mile (5:37min/km). The spread between his aerobic and anaerobic thresholds is 23.5% (in terms of heart rate; 169/136) and 23% in terms of his pace (11:30/9:20). Because of all the high-intensity training he had done in the past few years, his anaerobic system has a high capacity.
In setting his zones, we used his heart rate drift test to set the top of his Zone 2 and his anaerobic threshold test to set the top of his Zone 3. When we did that, we saw that his purely aerobic zones 1 and 2 were squeezed below 136 at what he felt was a silly slow speed. He had a very broad Zone 3 because his muscles required a heavy dose of glucose to provide the energy he needed. His anaerobic system was the predominant fuel source, even at slow speeds. To better understand why this is a problem for an endurance athlete and an ever bigger one for ultra-long events like many of us engage in, please read this article https://evokeendurance.com/endurance-its-evolution-psychology-meaning-physiology-and-how-to-improve-yours/
The best course of action for him is to concentrate his training efforts on elevating his aerobic threshold to bring his aerobic and anaerobic metabolisms into a better balance for his endurance goals. He is suffering from a condition we see all too often: Aerobic Deficiency Syndrome.
Six months later, after doing almost all of his aerobic training in Zone 2 and having retested his aerobic and anaerobic threshold every 4-6 weeks or whenever he or his coach noticed an increase in his running pace at his aerobic threshold, his metabolism has begun to transform into that of an endurance athlete. His heart rate drift test now gives his aerobic threshold as 155 bpm and 9:45 min/mile (6:15 min/km). His anaerobic threshold has not moved because his training has been focused on fixing his aerobic deficit. There have been no workouts yet that provide a training stimulus to his anaerobic system. But now his aerobic and anaerobic thresholds are only 8% apart in terms of heart rate and 4.5% in terms of pace. His Zone 3 has shrunk to where it is only 14 bpm wide compared to 33 bpm wide when he started training this way.
The performance implications of this are profound. His aerobic capacity has increased dramatically. He can now comfortably sustain a running pace that is within 5% of the pace that took a maximum effort six months ago. His aerobic system is now able to fuel a much higher speed before having to call in the reserves, which are the anaerobic cavalry. Now his aerobic deficiency has been dealt a death blow, the gloves have come off, and the more interesting performance-related training is set to begin. His coach will begin programming more Zone 3 and 4 workots which will elevate his anaerobic threshold heart rate and pace.
The good news for Bob is that he has done all this in just six months. And this is just the tip of the iceberg in terms of improving his endurance. While his aerobic threshold heart rate may not move up much more, his pace at that heart rate can continue to increase for several more years under this kind of training approach. Along with more intensity training, his anaerobic threshold pace will also move up substantially. This AnT pace is the best correlation with endurance performance.
Bob is a runner, but the same concepts, principles, methods, and results work with all endurance athletes.
This is not some formula derived from scientific studies. It comes from the observations of many elite athletes by their coaches. Elites have a very high aerobic threshold and a very small Zone 3. The difference between being in a full aerobic metabolic state (in Zone 2) and going as fast as they can sustain for several minutes at a time (Zone 4) is only a few beats per minute and a handful of seconds per mile or kilometer. When the spread between the aerobic and anaerobic threshold drops to 10% or less, the athlete is considered to have a well-developed aerobic base and should begin to introduce more high-intensity training and reduce the time spent in Zone 2 because the pace/effort is too demanding muscularly.
NOTE: Before any of you math nerds out there correct my percentage calculations, I know that this is not the proper way of calculating percentage differences. However, the difference is tiny and immaterial, and the simplicity of the above method makes it much quicker and easier to use.
The simplicity and free cost of these tests allow you to repeat them anytime you choose. At Evoke, our coaches have used these tests with hundreds of athletes over the past seven years.
As a nice gauge of fitness, I will sometimes have my athletes conduct a couple of time trials at the beginning of our training together and repeat the tests a few months later. One test is done at the AeT heart rate to gauge the progress in aerobic capacity. And one is done at the AnT heart rate to test their endurance. While you can use different courses for the AeT and AnT tests, be sure to repeat the tests on the same course(s) under similar conditions so you are comparing apples to apples.

 EvokeCast