 Article
A New (and Better) Look at Training Peaks Metrics
By: Scott Johnston
Posted:
The metrics that Training Peaks produces using the data uploaded from your GPS/HR monitor watch have potent implications for monitoring, controlling, and adjusting your training. I’ve often said that anyone can write a training plan….but the challenge is successfully applying it to the athlete so that it produces the best results. One of the biggest problems for coaches and athletes alike is assessing the training load on both a short and long-term basis and the effect that load has on the athlete. That’s been the driver behind the recent explosion in the use of the HRV (heart rate variability) features that have been appearing on every fitness app. The last article I wrote on this subject was at least six years ago and was due for an update. This latest version goes a bit deeper into the magic behind the metrics.
I will leave HRV for another discussion and focus on the Training Peaks metrics in the article. We frequently field questions concerning their meaning and interpretation. A brief history is in order to set the stage.
Training Peaks was initially set up to serve triathletes and cyclists. A clever exercise physiologist, Andrew Coggan, was looking for ways to quantify training load, fitness, and fatigue and developed the Training Peaks system. His models are a simplified version of an existing mathematical model developed by Eric Banister using the acronym TRIMP (TRaining IMPulse). The result was called the Performance Manager. For a VERY in-depth look at both these models, read this.
The exact details of these models and how they were arrived at are not important to the casual user. So, if you are willing to believe that Coggan’s models are accurate, we can move on to user-level discussion.
Like any discussion, it is essential to start with a shared understanding of the terms and concepts we will discuss.
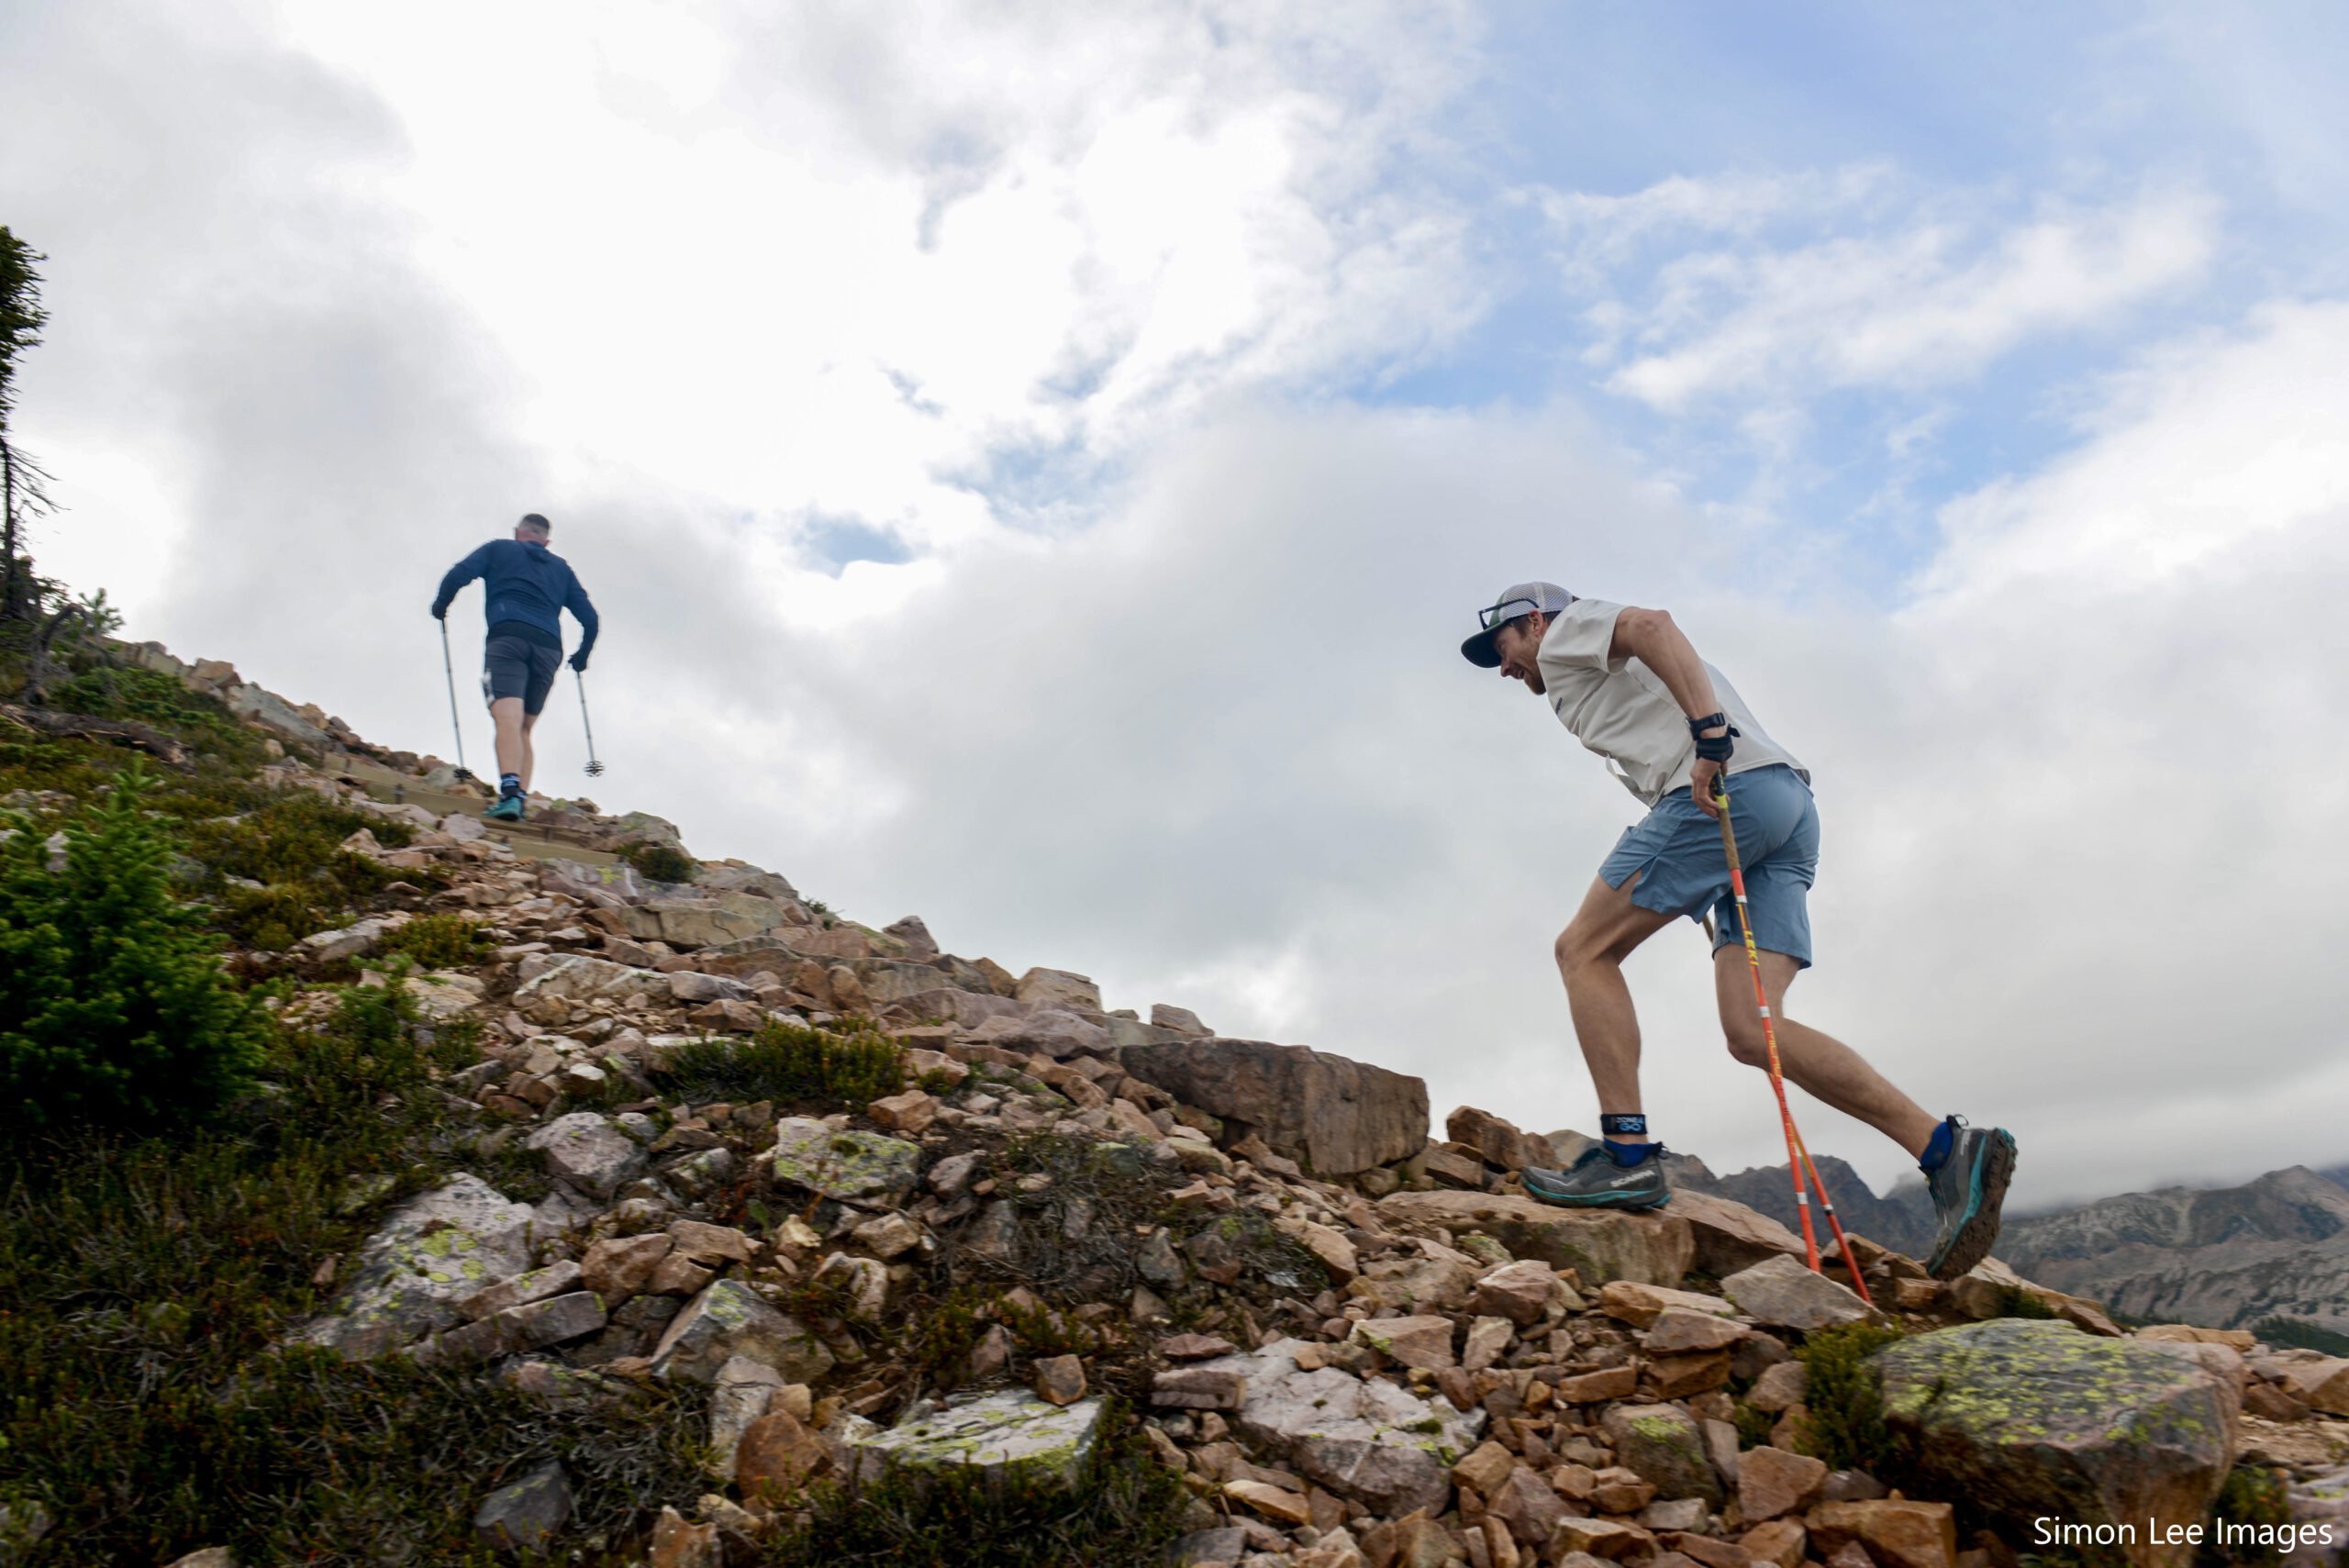
TSS– Training Stress Score is the foundational element of the whole system. Get this wrong, and the rest of the metrics won’t be correct. Like any algorithm, poor input data will yield poor output data. TSS quantifies the training load imposed by an individual training session. It is based on the duration and intensity of that session. Several methods of measuring TSS exist. This model uses the maximum sustainable intensity one can sustain for an extended time to establish a benchmark for the TSS. The ‘extended’ time will vary from 30 minutes for a moderately fit amateur to 60 minutes for an elite. That intensity can be measured by: power, pace, or heart rate. We call this by the old school name of the anaerobic threshold (AnT). Other names are Lactate Threshold (LT), Functional Threshold Power/Pace (FTP), and Critical Power/Pace. Establishing this intensity is vital to getting an accurate TSS.
*Running power meters are discussed later.
CTL– Chronic Training Load measures how much training the athlete has been doing during the past six weeks. Based on TSS, it considers both the volume and intensity of that training. It uses an exponentially weighted running average TSS. That means the training you’ve done in the past few days affects the CTL number much more than the training you did six weeks ago. CTL is a reflection of only the positive effects that come from training. It makes intuitive sense that athletes who train more will be more fit. So, CTL is itself a proxy for your fitness. It is relevant only to yourself and not an absolute measure of fitness.
ATL-Acute Training Load is a backward-looking, exponentially weighted algorithm based on TSS for the last seven days. But this training has a more fatiguing effect than the training you did several weeks ago. So ATL is considering the negative (fatigue) effects of training. ATL is also a relative measure of fatigue, not an absolute value.
TSB– Training Stress Balance Is the difference between CTL and ATL (CTL minus ATL). Imagine that it is the sum of the positive training effects (increased fitness) and the adverse training effects (fatigue). This number should reflect the performance potential of the athlete. As anyone who has trained consistently before, fatigue will mask fitness such that you can’t express your full fitness potential when fatigued. TSB quantifies this again in a relative way.
The statements about the relative nature of these metrics were not made lightly. The more history the athlete has with these metrics, the more helpful they become. A weekly TSS of 1000 is high for any athlete, but the CTL, ATL, and TBS can vary depending on the athlete’s history. An elite athlete with a CTL of over 150 can handle a weekly TSS of 1200 during routine training and manage a fatigue/ATL of 200 without overreaching. An amateur with a CTL of 60 might struggle to handle a weekly TSS load of 500, resulting in an ATL of only 70.
Your actual performance on any day results from the constant give-and-take tug-of-war between CTL and ATL given by TSB. CTL indicates the performance potential, and ATL shows the potential performance reduction due to fatigue.
This is where the art of coaching comes in. Even using the Performance Manager, the trick is balancing the chronic and acute training load to arrive at the best performance on a given day. That can only be done with experience and a good data set.
The lesson here is the combination of the hard data from your GPS/HR watch combined with your notes on your subjective feelings about fatigue and fitness (that you should be keeping track of in the comments section) for each workout are a potent tool in your training toolbox.
The Performance Management Chart in the dashboard of all Training Peaks Premium account users is where these numbers find their graphical representation, as shown below. Here’s a short video walkthrough of the basics of the Performance Management Chart.
*if this language is confusing, you would be well served to read chapter two of Training for the Uphill Athlete to better understand endurance physiology.
A hard muscular workout, such as a grueling ME workout, typically has a very high local muscular endurance factor at a (disappointingly) low heart rate. To determine TSS, pick a number that reflects the recovery time before you feel ready for another such workout. For slow twitch muscle fiber–dominant athletes, these ME workouts take a significant toll and require 72 hours of recovery, during which only easy aerobic work is done. If that is you, score your ME workouts at 150–200 TSS. Fast twitch–dominant athletes with a lot of strength training or sprinting in their backgrounds can handle these ME workouts more easily and can bounce back in 48 hours. If you fall into this camp, give your ME workouts 100 TSS.
Training for the New Alpinism general strength and core workout:
Give this a TSS of 50–70/hour.
TftNA max strength with a core warm-up:
Give this a TSS of 80–90/hour.
We consider climbing sessions to be strength training. As mentioned above, the Training Peaks metrics do not accurately reflect strength training sessions, especially when using hrTSS, because heart rate is a poor proxy for effort.
Perhaps these fudge factors seem arbitrary and too formulaic to apply across broad swaths of athletes. Still, they reflect an attempt to portray workload and recovery times based on our observations with hundreds of athletes.
I want to start with a disclaimer: I am not very knowledgeable about power meters. I bought and tried one of the earliest Stryd power meters several years ago. It didn’t reflect my perceived exertion on either uphills or downhills. It was a shot in the dark, as I think they were intended for road runners.
The offerings in the running power meter market are much increased and improved. Most watch companies offer this feature and several claim that theirs will work well for trail running by including the athlete’s elevation change in their algorithm.
The way these things work is that using accelerometers, they measure things like vertical oscillation, ground contact time, elevation change, and probably a few other things. They do this by collecting data from your HR chest strap, a foot pod, or the watch itself. They feed this data into their proprietary algorithm and out pops a running power number in watts.
I have no experience with any of the major brands’ power meters. In my quest to learn more about power numbers for monitoring training, I stumbled across an interesting website by physicist/mountain runner Markus Holler. Markus has developed his algorithm (for Garmin only) that will crunch the same input data. On his site, Markus details what goes into his model vs. what he thinks might be missing from the big brands’ models. I was so impressed with Markus’s clear explanation and transparency that I immediately bought his e-book (available on his site) to learn more about running power, how it is modeled, and how to train and race using it. I recently did a podcast with Markus where he leads us through the basics of measuring power in trail running and then explains how the data can be fed into the Training Peaks Performance Manager. The result will be a much more accurate TSS for trail runners.
One of its most unique features is that in the setting of the app you can include the weight of a pack you might be carrying. This will be important to ultra runners who might be carrying 2-3kg on very long runs. Markus does not think it will work so well for mountaineers carrying a heavy pack. In that case, the muscular load is much higher, and the training effect is a bit different. Mountaineers might still have to rely on the fudge factors described above.
*I had originally stated here that I didn’t think that the RunPowerModel could account for carried weight. Markus brought this to my attention.
I’m very intrigued by what I have learned from Markus and feel that this is a significant step in making the science part of training for trail/mountain more exact. There will remain the art component.
NOTE:
In the early days of Uphill Athlete and my earliest and incomplete understanding of the Performance Manager, I suggested that mountain athletes could achieve CTL fitness scores to ensure their fitness was sufficient for a particular objective. My heart was in the right place in wanting to simplify training down to one number for folks to target. Even then, I recognized that this would not work as well for mountain objectives as it was working in the triathlon world, where a CTL of 150 was considered the price of admission to a sub-9-hour Ironman triathlon.
In my more limited experience working with the Performance Manager (this was eight years ago), I saw a trend that I thought would be helpful. I posted specific numbers on the Uphill Athlete site about different CTLs needed to assure the climber that their fitness was adequate for the task.
Boy, did I open a can of worms. I’m flattered to think people took my words to heart, but I’m as fallible as the next person. I had intended those numbers to be rough guidelines encouraging people to be well prepared for their climb, not as hard and fast rules. Before the concepts I had developed and written in both books were widely accepted, there wasn’t a culture of training for big climbs. Many people were undertaking mountain climbs for which they were unprepared, often with severe consequences.
Two things have happened in those intervening years. There is now a more robust culture of mountaineering training. And our coaches and I have often had to explain away the climber’s apprehension that not having a CTL of 100 would mean they were unprepared for Denali.
The preceding discussion should clarify that holding a CTL above 100 for a month will make an athlete fitter than that athlete holding a CTL above 80 for two weeks after a week of over-reaching.
I should have known better……but…… I will no longer try to predict fitness for people whose training I am unfamiliar with.

 EvokeCast